> ## Documentation Index
> Fetch the complete documentation index at: https://wb-21fd5541-feat-cli-docs-generator.mintlify.site/llms.txt
> Use this file to discover all available pages before exploring further.
# レポートを作成する
> W&B レポートは、App UI を使用するか Weights & Biases SDK を使ってプログラムで作成します。
レポートを作成するには、W\&B App UI をインタラクティブに使用するか、W\&B Python SDK を使用してプログラムで行います。
この[Google Colab の例](https://colab.research.google.com/github/wandb/examples/blob/master/colabs/intro/Report_API_Quickstart.ipynb)を参照してください。
1. W\&B App でプロジェクトワークスペースに移動します。
2. ワークスペースの右上隅にある **Create report** をクリックします。
 3. モーダルが表示されます。最初に使用したいチャートを選択します。レポートのインターフェースから後でチャートを追加または削除することができます。
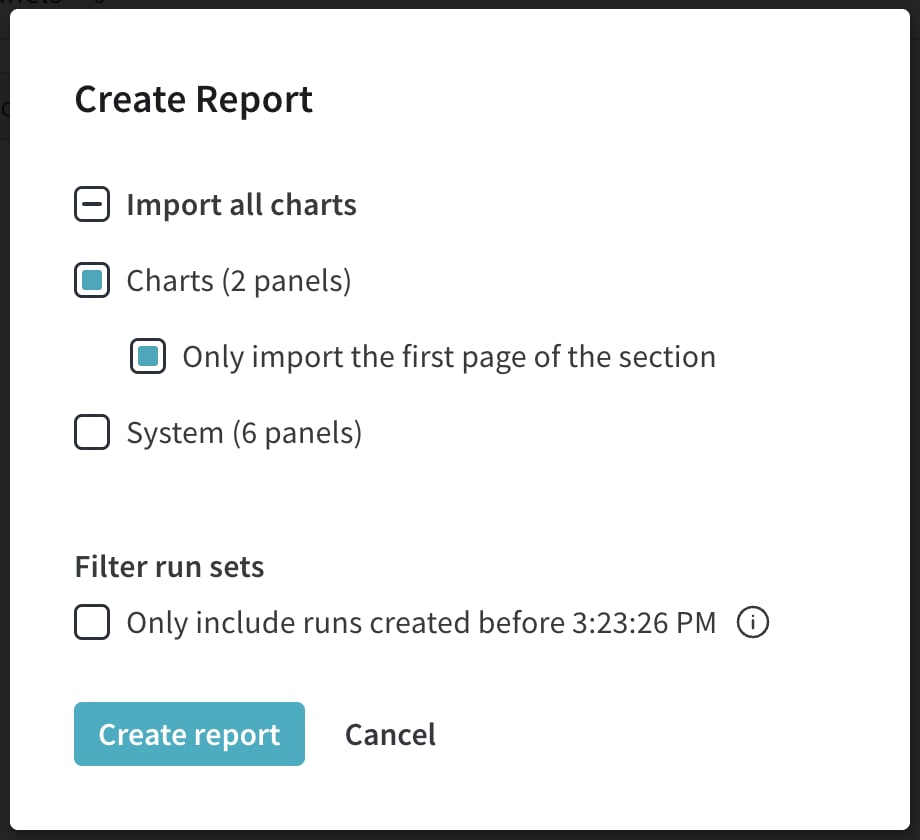 4. **Filter run sets** オプションを選択すると、新しい run がレポートに追加されるのを防げます。このオプションをオンまたはオフに切り替えることができます。**Create report** をクリックすると、レポートタブにドラフトレポートが表示され、作業を続けることができます。
1. W\&B App でプロジェクトワークスペースに移動します。
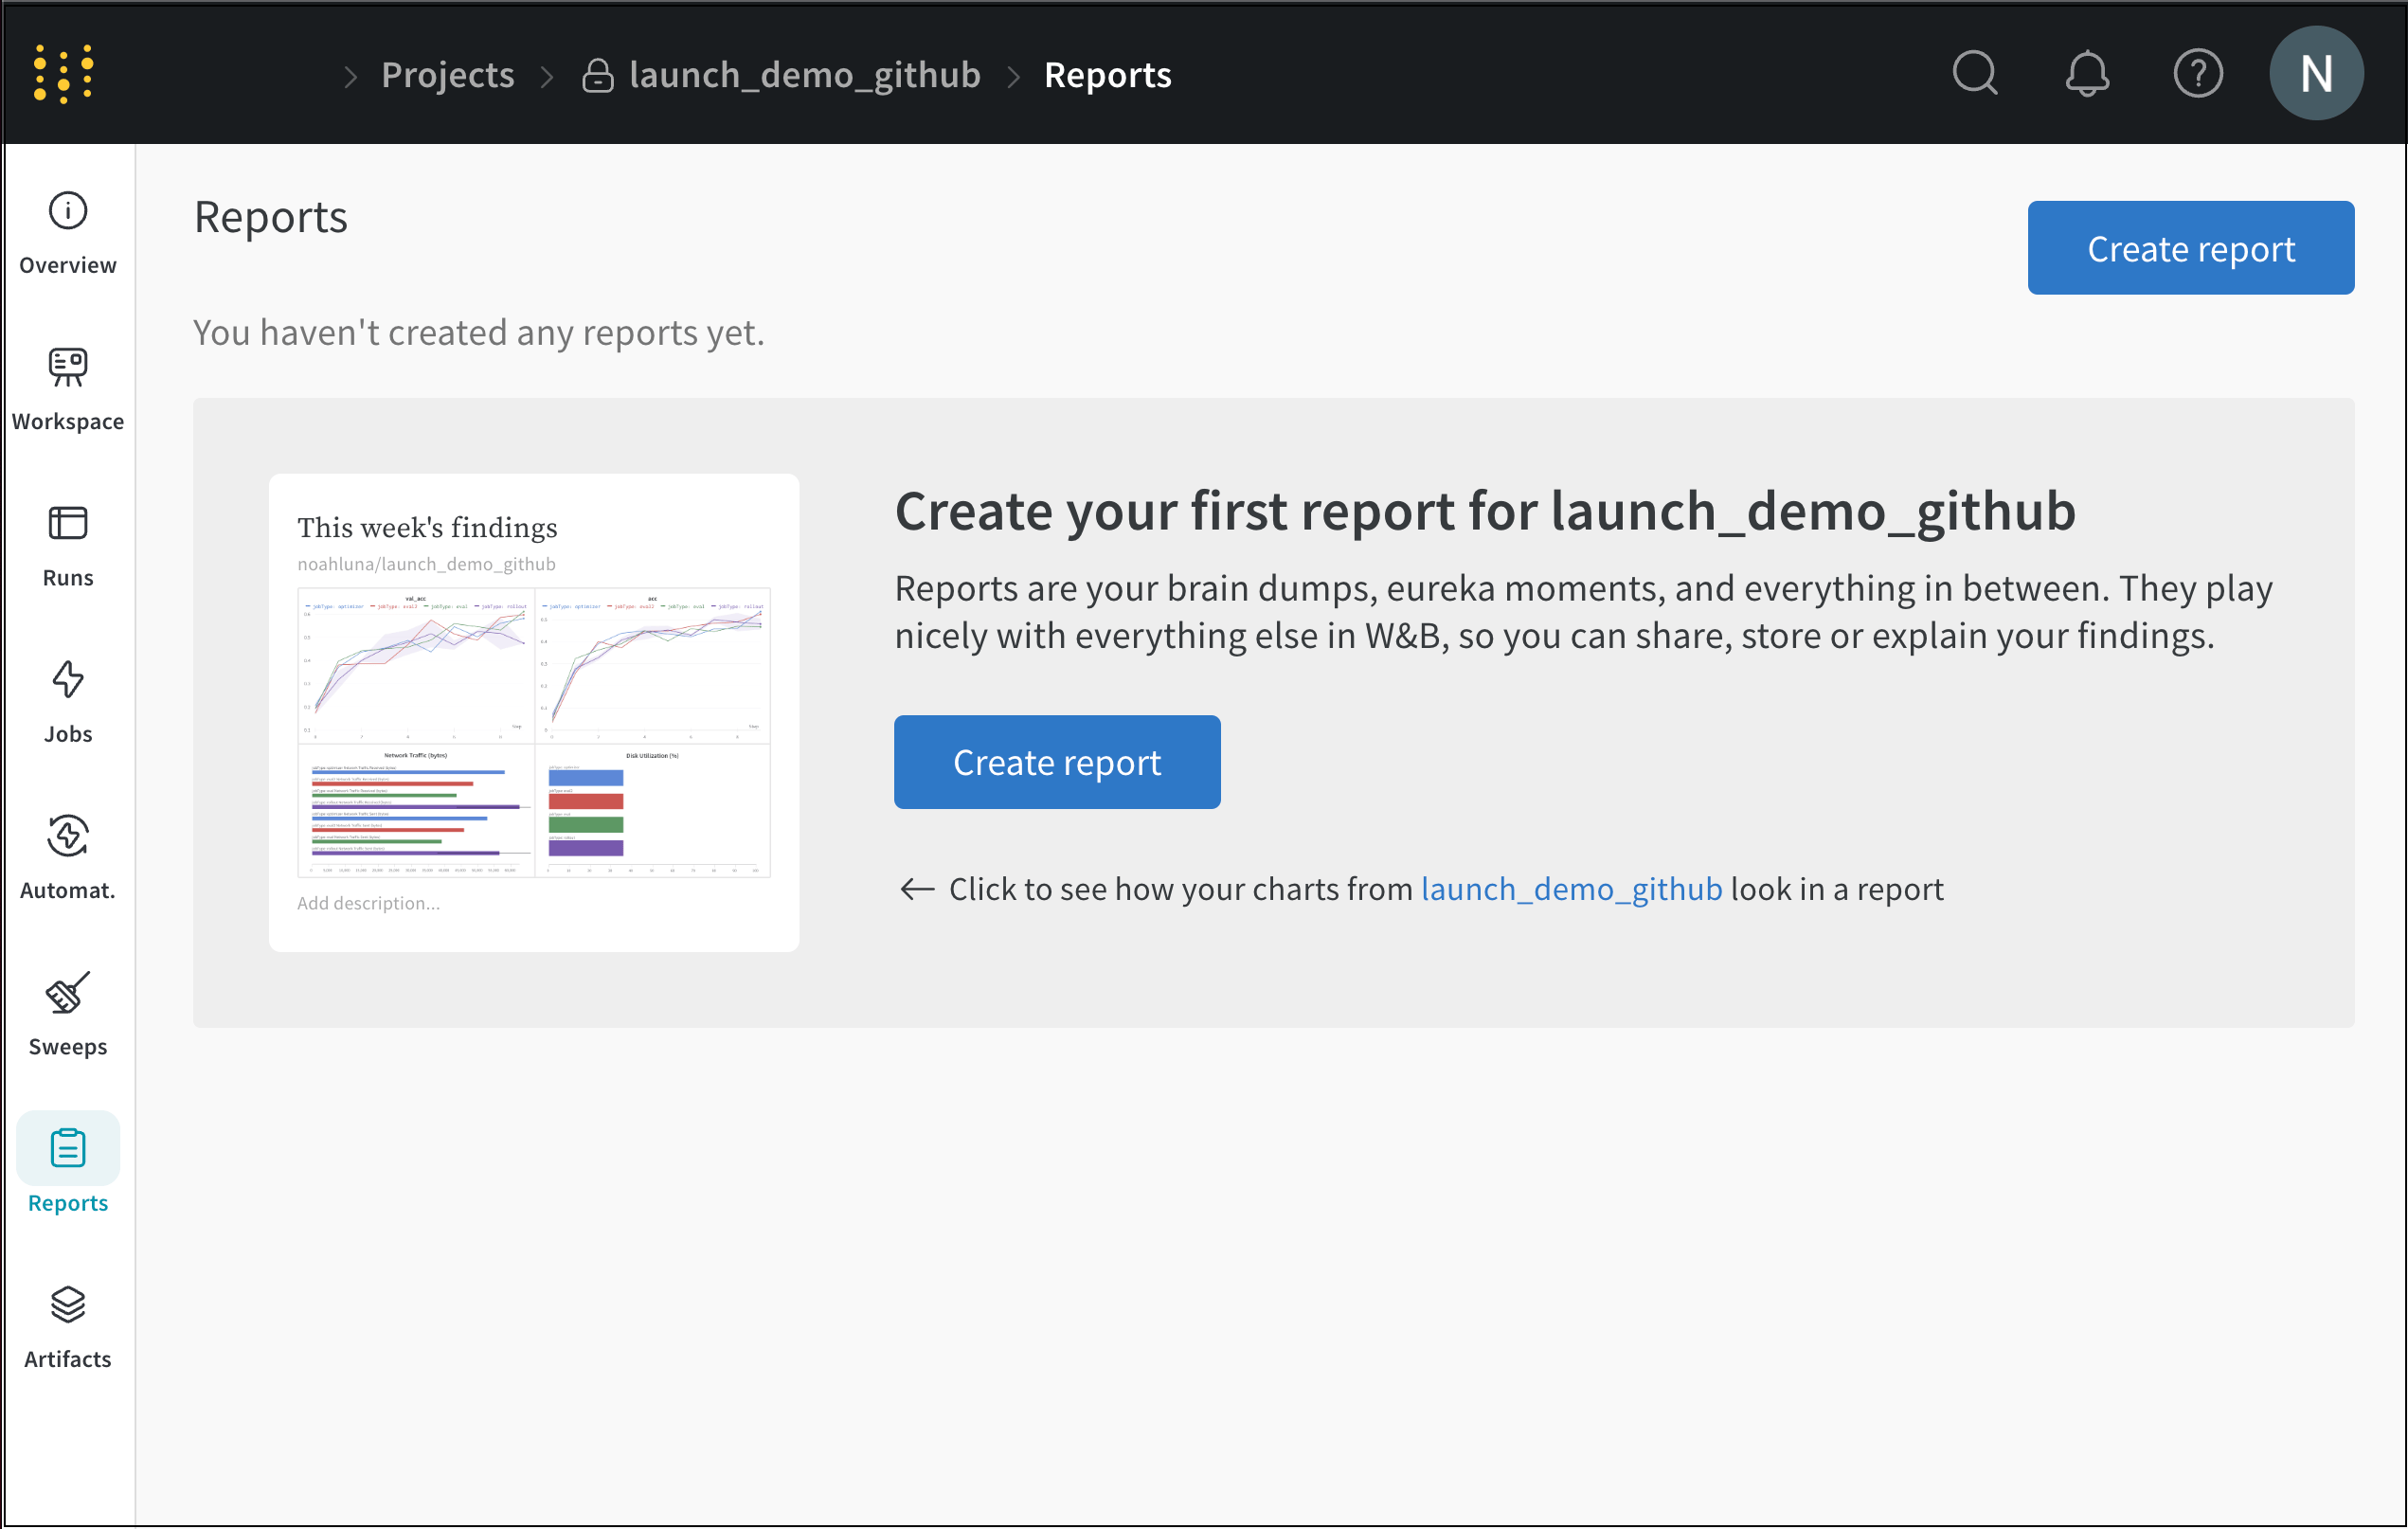
2. プロジェクト内の **Reports** タブ(クリップボードの画像)を選択します。
3. レポートページで **Create Report** ボタンを選択します。
4. **Filter run sets** オプションを選択すると、新しい run がレポートに追加されるのを防げます。このオプションをオンまたはオフに切り替えることができます。**Create report** をクリックすると、レポートタブにドラフトレポートが表示され、作業を続けることができます。
1. W\&B App でプロジェクトワークスペースに移動します。
2. プロジェクト内の **Reports** タブ(クリップボードの画像)を選択します。
3. レポートページで **Create Report** ボタンを選択します。
 `wandb` ライブラリを使用してプログラムでレポートを作成します。
1. W\&B SDK と Workspaces API をインストールします:
```bash theme={null}
pip install wandb wandb-workspaces
```
2. 次に、ワークスペースをインポートします。
```python theme={null}
import wandb
import wandb_workspaces.reports.v2 as wr
```
3. `wandb_workspaces.reports.v2.Report` を使用してレポートを作成します。Report Class Public API ([`wandb.apis.reports`](/ja/models/ref/python/public-api/api#reports)) を使ってレポートのインスタンスを作成します。プロジェクトに名前を指定します。
```python theme={null}
report = wr.Report(project="report_standard")
```
4. レポートを保存します。レポートは、`save()` メソッドを呼び出すまで W\&B サーバーにアップロードされません。
```python theme={null}
report.save()
```
App UI を使用してインタラクティブに、またはプログラムでレポートを編集する方法については、[Edit a report](/ja/models/reports/edit-a-report/) を参照してください。
`wandb` ライブラリを使用してプログラムでレポートを作成します。
1. W\&B SDK と Workspaces API をインストールします:
```bash theme={null}
pip install wandb wandb-workspaces
```
2. 次に、ワークスペースをインポートします。
```python theme={null}
import wandb
import wandb_workspaces.reports.v2 as wr
```
3. `wandb_workspaces.reports.v2.Report` を使用してレポートを作成します。Report Class Public API ([`wandb.apis.reports`](/ja/models/ref/python/public-api/api#reports)) を使ってレポートのインスタンスを作成します。プロジェクトに名前を指定します。
```python theme={null}
report = wr.Report(project="report_standard")
```
4. レポートを保存します。レポートは、`save()` メソッドを呼び出すまで W\&B サーバーにアップロードされません。
```python theme={null}
report.save()
```
App UI を使用してインタラクティブに、またはプログラムでレポートを編集する方法については、[Edit a report](/ja/models/reports/edit-a-report/) を参照してください。